Note that this only works for undirected graphs. Regardless of whether the input graph is directed it is treated as undirected graph.
plot_gaps(
  net,
  motif,
  lvl_attr = c("sesType"),
  level = -1,
  cutoff = 2,
  subset_graph = "none",
  ...
)
Arguments
| net | Statnet network object |
|---|---|
| motif | Motif to explore gaps in for |
| lvl_attr | Node attribute specifying level information |
| level | Focal level for gap analysis |
| cutoff | Cut-off point in contributions of an edge to the number of motifs above which to analyse gaps |
| subset_graph | Whether to subset the graph to only show nodes involved in gaps. One of "none" (no subset, default), "partial" (only focal level is subset) or "focal" (only focal level shown) |
| ... | list of additional parameters to be passed to plotting function
(see |
Value
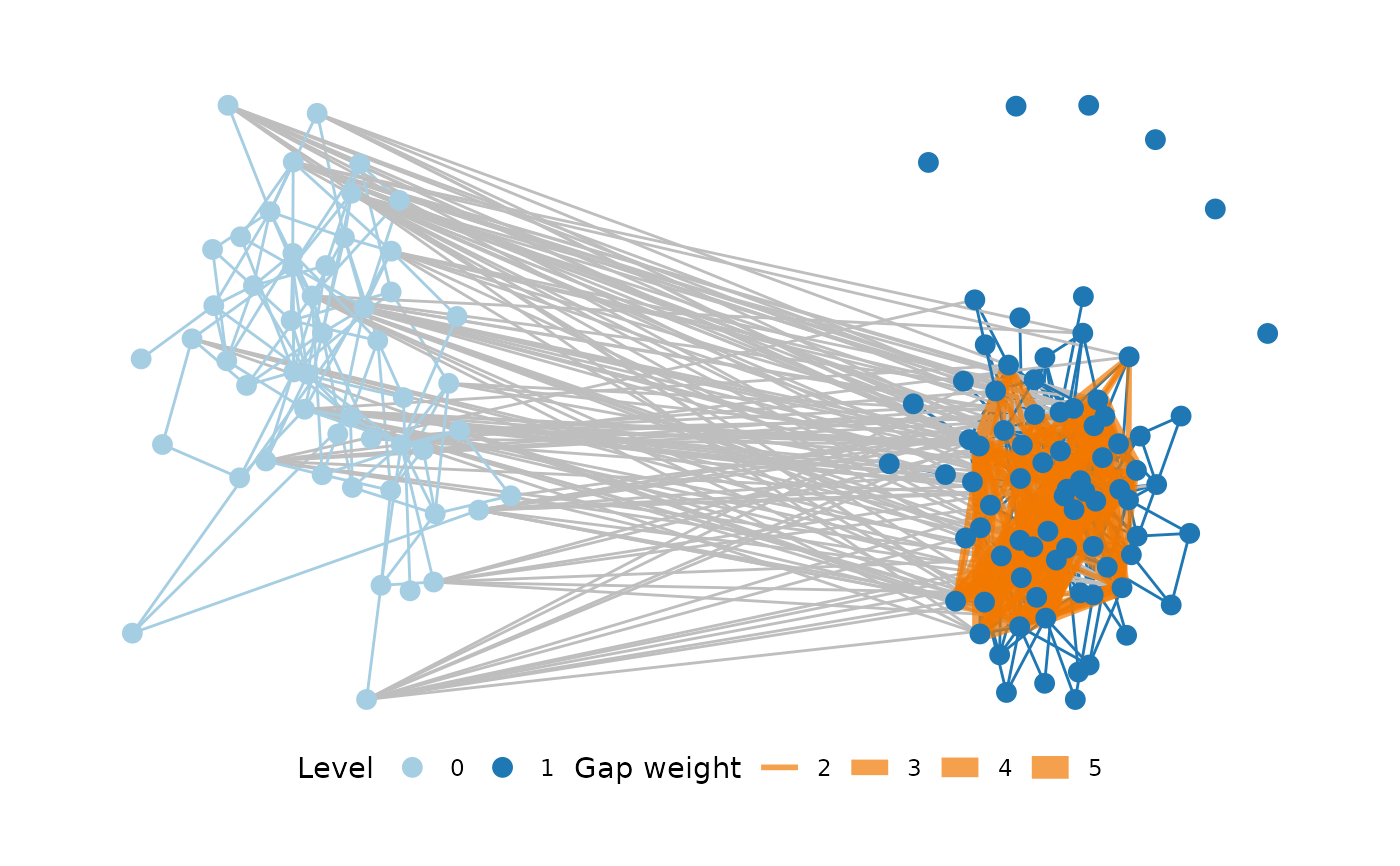
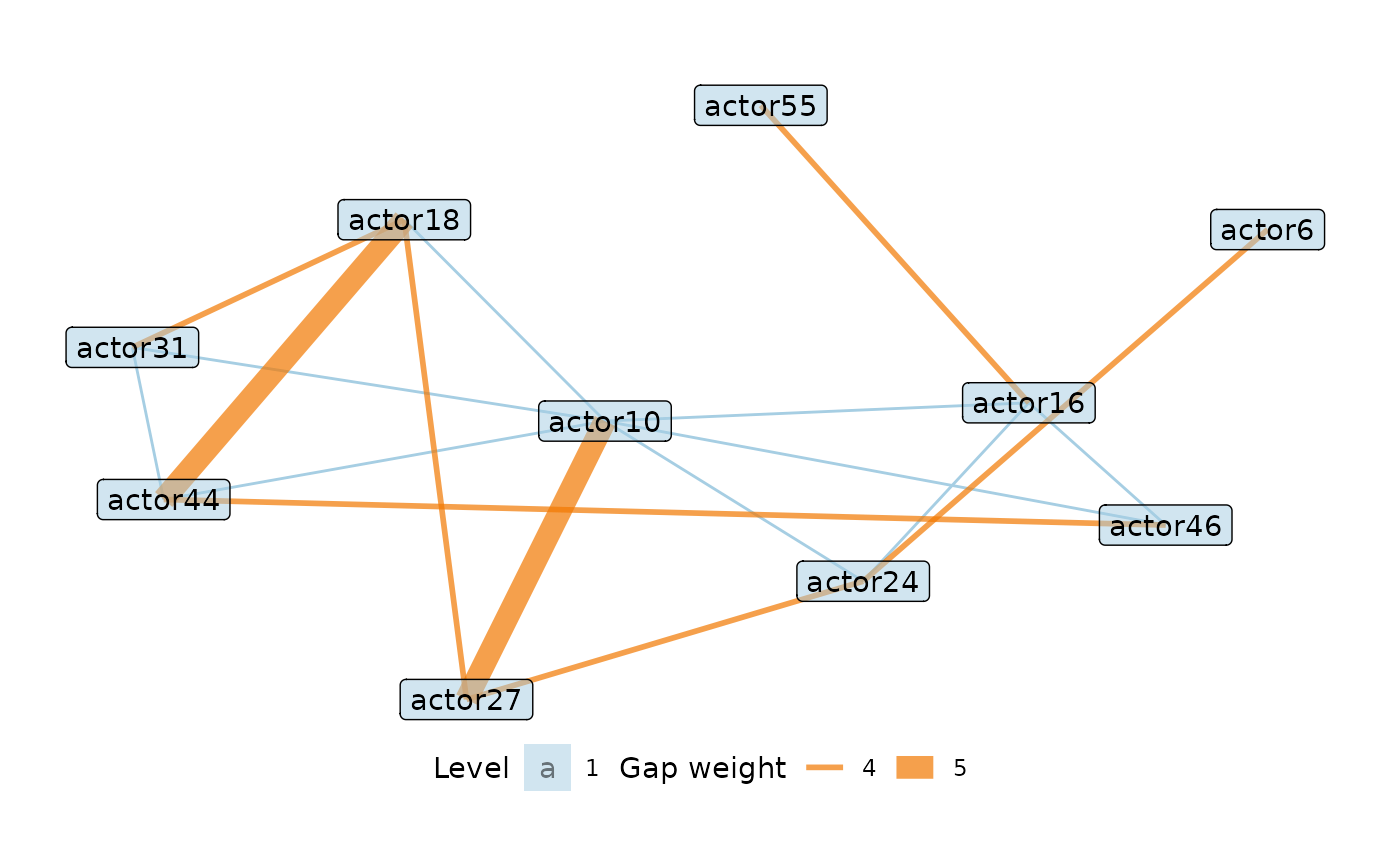
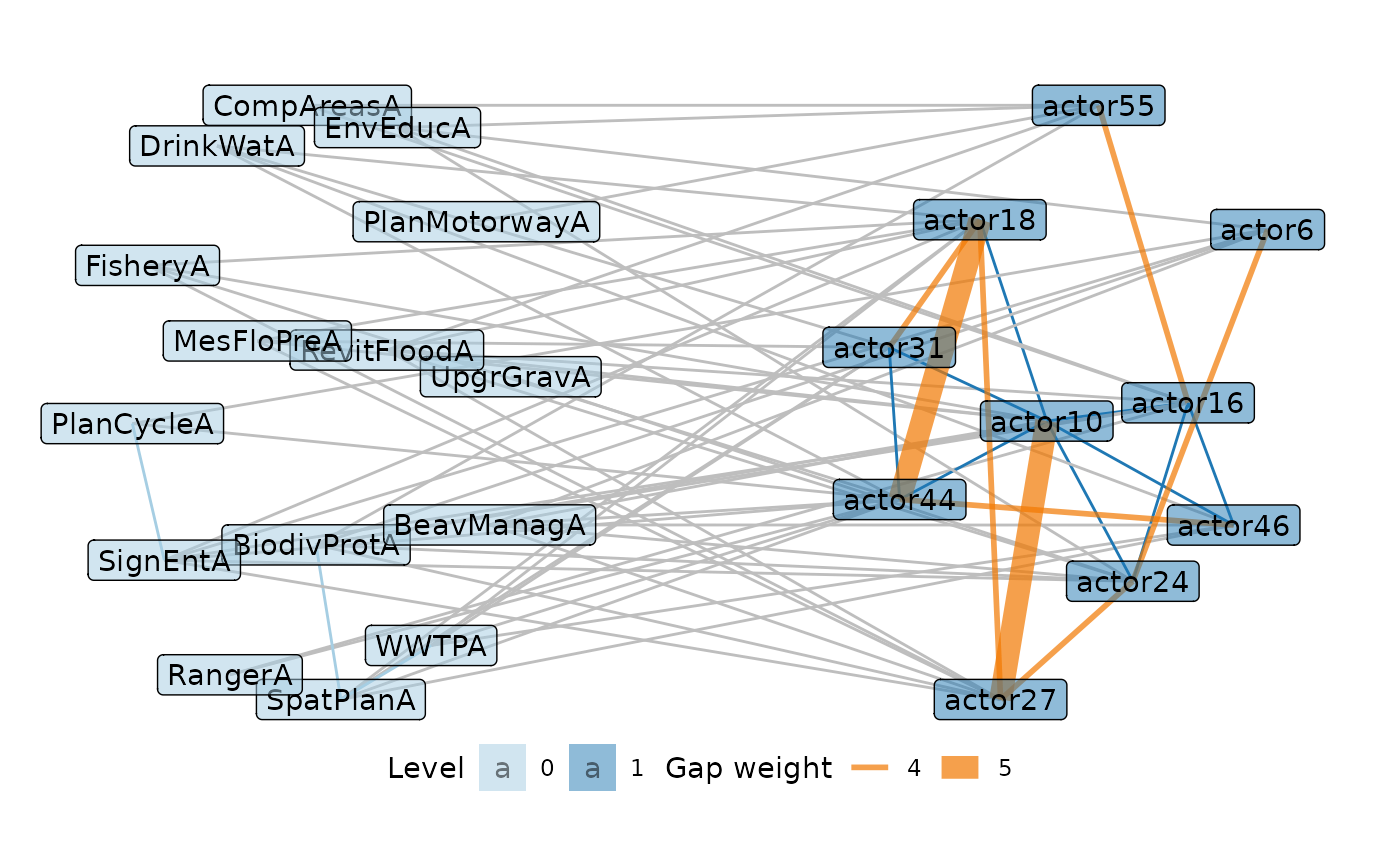
A plot of gaps, sized by weight in a multilevel network
Examples
# \dontrun{ plot_gaps(ml_net, "1,2[II.C]", level = -1)plot_gaps(ml_net, "1,2[II.C]", level = -1, subset_graph = "focal", cutoff = 4, label = TRUE )plot_gaps(ml_net, "1,2[II.C]", level = -1, subset_graph = "partial", cutoff = 4, label = TRUE )# }